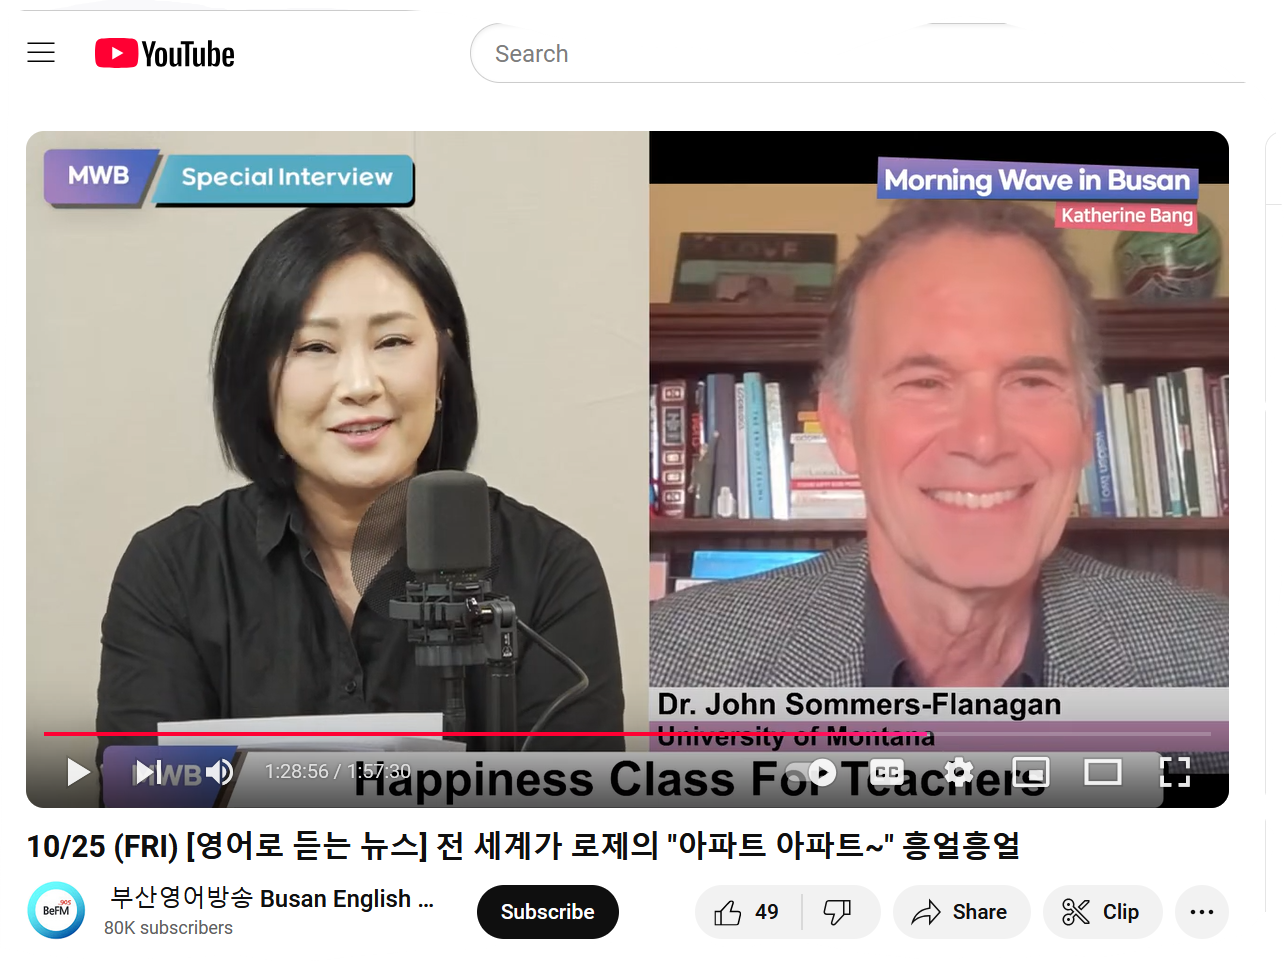

Earlier this week I found a parallel universe wherein I was able to convince three people that it would be terribly fun to sit with me in a classroom for 2+ hours and work through the post-course data from our most recent “Happiness for Educators” class. This involved me figuring out how to screencast my computer onto a big screen where I went through the process of accessing our Qualtrics file and exporting the data to SPSS. Then, while experiencing intermittent fits of joy, we cleaned the data, used the “recode” function to reverse score all the items requiring reverse scoring and then calculated our 16 different outcome variables.
In this parallel universe, the three people who joined me (you know who you are), asked great questions and acted interested the WHOLE time. Of course, one of the “people” is a well-established Missoula actor, so there’s the possibility that I was fooled by some excellent acting or feigning or pretending. That said, finding a parallel universe where people act interested in stats remains a feat to brag about.
We made it through all the post-test data. To maximize the fun and bring us all to a place of breathless excitement, I ran a quick descriptive analysis. At first glance, the data looked okay, but not great. Of course, we didn’t have the pretest outcome variables analyzed, and so we were forced to leave with bated breath.
Today, access to the parallel universe was briefly adversely affected by a slight temporal shift; nevertheless, I found one of the “people” and she enthusiastically embraced another 2 hours of stats. . . . At the end, she shouted from her office, “That was fun!”
I know at this point, I am, as Freud might say, “straining your credulity” but I speak the whole truth and nothing but the truth.
And the rest of the truth gets even better. Tammy (my new best stats friend) and I found the following statistical results.
- 89 of 100 students completed the pre-post questionnaires.
- We had statistical significance on ALL 16 outcomes—at the p < .01 level (or better).
- The effect sizes (Cohen’s d with Hedges adjustments) were among our best ever, with top outcomes being:
- Improved positive affect (feeling more cheerful, etc): d = .900 (a LARGE effect size)
- Reduced negative affect (feeling fewer negative emotional states) d = 885. (a LARGE effect size)
- Improved total self-reported physical health (a compilation of better sleep, reduced headaches, reduced gastrointestinal symptoms, fewer respiratory symptoms) d = .821 (a LARGE effect size)
- Reduced depression (as measured by the CES-D): d = .732 (an almost LARGE effect size)
If you’re reading this, I hope you’re skeptical. Because if you’re skeptical, then I’m sure you’ll want to know whether this is the first, second, third, or fourth time we’ve found this pattern of results. Nope. It’s the FIFTH consecutive time we’ve had all significant outcomes or nearly all significant outcomes that appear to be happening as a function of our happiness for educators course.
Although I am in constant fear that, next time, the results will be less impressive, I’m getting to the point where I’m thinking: These results are not random error, because we now have data across five cohorts and 267 teachers.
If you’re reading this, I also hope you’re thinking what I’m thinking. That is: You should take this course (if you’re a Montana educator) or you should tell your Montana educator friends to take this course. If you happen to be thinking what I’m thinking, here’s the link to sign up for our summer sections.
It’s a pretty good deal. Only $95 to experience more positive emotions, fewer negative emotions, better physical health, reduced depression, and more!